


Mid-season stats wrap
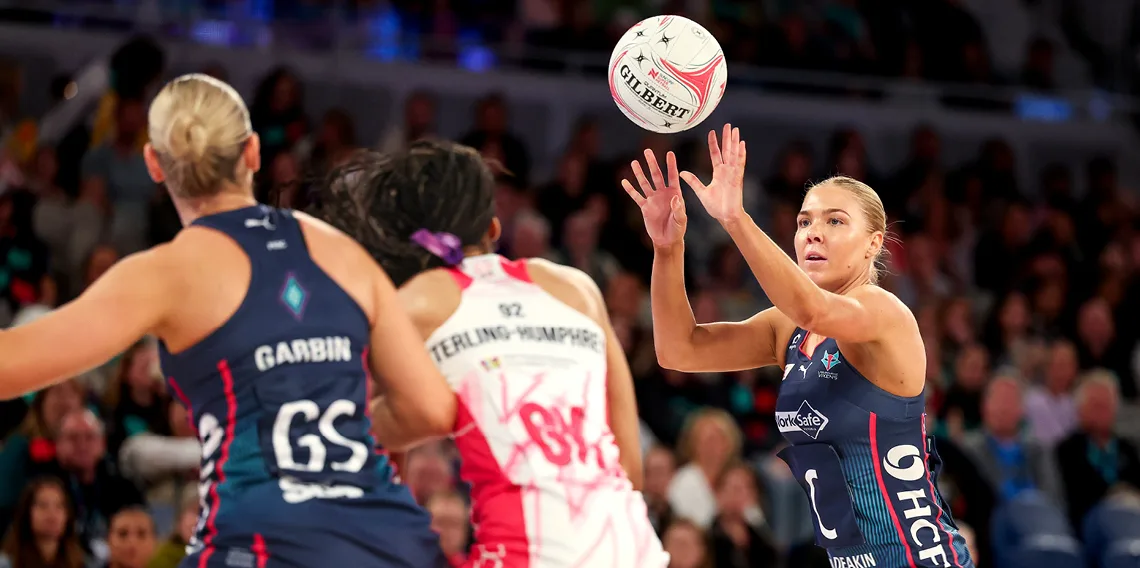
A deep dive into the statistics that have defined the Vixens’ 2024 campaign so far, thanks to Champion Data and written by Amelia Barnes.
There are only four games left to play in the regular 2024 SSN season and the Melbourne Vixens are sitting at the top of the ladder.
Take a closer look at the key stats that have shaped the Vixens’ season to date, from the best Nissan Net Points scores to the gain to goal rate % that could hold the key to finals success.
The numbers so far
Gain to goal rate
If there’s one stat that best determines the Vixens’ success, it’s the gain to goal rate (GAG%).
A gain to goal is achieved when a player gets the ball through individual effort (such as a block, intercept, pickup, rebound, or deflection) that results in a goal for their team.
Vixens’ GAG% for the season is 69.3% (third in the league), and the only match they’ve dropped below 50% was in the Round 6 Lightning loss, where the Vixens’ GAG% was 47.9% compared to the Lightning’s 77.3%.
The Vixens’ highest GAG% was 91.7% in the 19-goal Round 10 win against the Melbourne Mavericks.
Centre pass conversion rate
Centre pass to goal conversion rate (GCP%) is another key indicator of netball performance.
Vixens sit third in the league for GCP% this season at 72.8%, compared to West Coast Fever who top this stat with 79.3%.
The Vixens’ highest GCP% was 84.6% in Round 7 against the Fever, who recorded 70.3%.
The Vixens’ lowest GCP% was 62.7% in the 1-goal Round 2 win against the Adelaide Thunderbirds.
Where the Vixens excel
The team season average stats indicate that the Vixens cherish the ball in possession and work hard to win ball back through intercepts.
The Vixens’ best season average stats are for:
Bad hands: average 1.2 per game (best in the league)
Intercepts: average 7.1 per game (second best in the league)
Feeds: average 93.4 per game (second best in the league)
Gains: average 13.7 per game (second best in the league)
Offensive rebounds: average 4.7 per game (second best in the league)
Rebounds: average 7.8 per game (second best in the league)
Turnovers: average 22.1 (second best in the league)
Room for improvement
The Vixens’ negative statistics show some areas for improvement across the court.
Most notably, the team have recorded the fewest deflections in the league (although this is arguably outweighed by having the second-most intercepts on average) and have a high penalty count, a reflection of the side’s full-court approach to contesting and pressure.
The Vixens’ weakest season average stats are for:
Deflections: 13.4 (lowest in the league)
Contact penalties: 47.5 (second highest in the league)
Penalties: 58.6 (second highest in the league)
Nissan Net Points
Nissan Net Points (NNP) are a metric used to track players’ individual performances. Read a breakdown of how the points are achieved.
While NNP don’t account for some crucial defensive metrics such as applying pressure to limit an opposition player’s feeds, goal attempts, or centre pass receives (justice for WDs!), they can offer an interesting comparison point between matches or seasons.
Highest team NNP score
The Vixens’ highest team NNP score of the season so far was 503.5 in the 11-goal win against Fever in Round 7.
Highest individual NNP score
Kiera Austin achieved the Vixens’ highest individual NNP score of the season so far with 129 NNP in the 19-goal win against Melbourne Mavericks in Round 9.
Vixens dominating their positions
Six Vixens players sit in the top NNP performers for their position in 2024.
Emily Mannix has the highest average NNP score for a GD at 55.7. She also has the highest individual score for a GK this season, achieving 123 NNP in the 19-goal win against GIANTS in Round 3.
Kiera Austin has the highest average NNP score for a GA at 68.6.
Sophie Garbin has the second highest average NNP score for a GS at 75.4.
Kate Moloney has the second highest average NNP score for a C at 86.8.
Jo Weston has the fifth highest average NNP for a GD at 37.4.
Zara Walters has the fifth highest average NNP for a WA with 55.5, achieved in her three matches played prior to injury.
Vixens playing at their career best
The following Vixens have achieved a higher NNP average score this season than their career average.
Kate Moloney: 86.8 NNP season average, 63.9 NNP career average
Sophie Garbin: 75.4 NNP season average, 29 NNP career average
Kiera Austin: 68.6 NNP season average, 49.4 NNP career average
Emily Mannix: 55.7 NNP season average, 42.4 NNP career average
Hannah Mundy: 55.1 NNP season average, 31.7 NNP career average
Rudi Ellis: 28.8 NNP season average, 16.1 NNP career average
The anomaly
Stats don’t tell the whole story, and that’s especially evident in the numbers from the Round 2 game between the Vixens and Adelaide Thunderbirds.
Vixens won the match but achieved their lowest NNP team score at 281.5 – 42.5 less points than their second lowest score recorded in the loss against the Sunshine Coast Lightning in Round 6.
The Thunderbirds recorded a much higher 416.5 NNP team score, but still lost the game by one goal (it’s worth noting that the Thunderbirds had 10 players who took to the court, compared to the Vixens’ seven.)
The Vixens also lagged in most key stats on the day with more general play turnovers, a lower GCP%, and half the number of goals from gains compared to the Thunderbirds.
What won the Vixens the game was their more accurate shooting, including eight successful super shots compared to the Thunderbirds’ zero.
All statistics courtesy of Champion Data
More news

We acknowledge the traditional owners and custodians of all the lands and waters where netball is played throughout Victoria and pay our respects to Elders past and present. We also wish to recognise the tremendous contribution Aboriginal and Torres Strait Islander people make to sport, and in particular netball in Victoria. We are committed to a journey of Reconciliation, working to break down barriers and ensuring equal opportunities for both Aboriginal and Torres Strait Islander and non-Aboriginal and Torres Strait Islander communities across our state.

Netball Victoria is a proudly diverse and inclusive organisation, that actively celebrates LGBT+ diversity, inclusion and pride within the sport of netball throughout Victoria.
The Melbourne Vixens compete in Australia’s premier netball league, Suncorp Super Netball.
Read more
My items
You have not looked at any packages recently.
There are no featured packages.